
價格:免費
更新日期:2018-12-05
檔案大小:22.8 MB
目前版本:2.1
版本需求:需要 iOS 8.0 或以上版本。與 iPhone、iPad 及 iPod touch 相容。
支援語言:英語
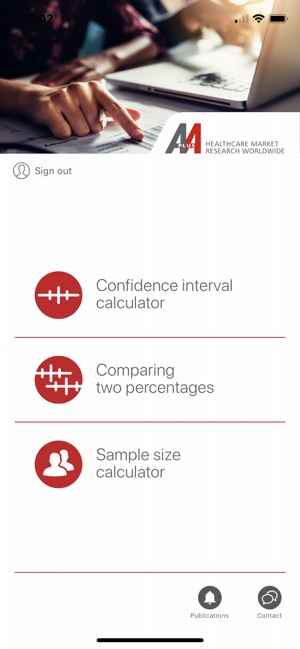
3 common statistical tools used to analyze market research results:
1 - CONFIDENCE INTERVAL CALCULATOR
2 - COMPARING TWO PERCENTAGES
3 - SAMPLE SIZE CALCULATOR
-----------------------------------------
1 - CONFIDENCE INTERVAL CALCULATOR
Level of accuracy in percentages observed:
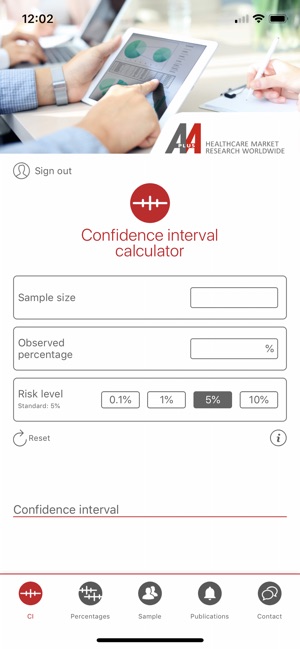
To conduct market research is to interview (or observe) a sample of individuals. The larger the sample, the greater the statistical accuracy. Confidence interval provides the level of accuracy of a given measure.
FOR INSTANCE
Upon interviewing a sample of 500 GP’s, 20% are found to be using Product A. So, what is, within the total population, the actual proportion of users of Product A.
Assuming 5% risk level*, confidence interval is:
• 20% +/-3.5
• [16.5%-23.5%]
In other words, there is a 95% probability that the actual percentage of Product A users in the total population of GPs is between 16.5% and 23.5%.
-------------------------------------
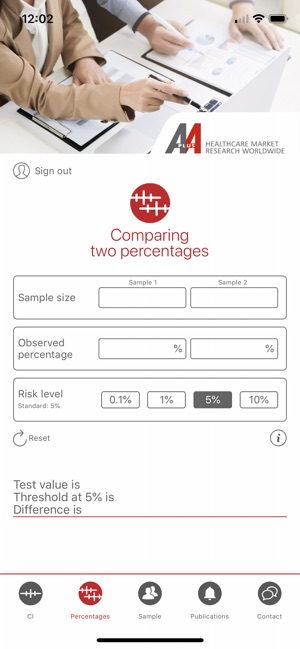
2 - COMPARING TWO PERCENTAGES
Statistical significance between 2 observed percentages:
When comparing opinions (or attitudes) measured on two samples, a significance test is applied. Significance tests provide an indication whether observed percentages are significantly different or not.
FOR INSTANCE
Upon interviewing a sample of 500 GP’s, 20% are found to be using Product A. Equally, upon interviewing a sample of 150 cardiologists, 25% of those are found to be using Product A. Would such a result suggest that a larger proportion of cardiologists is using Product A?
At 5% risk level*, the two percentages observed on these samples are not statistically different.
In other words, there is a 95% probability that the actual proportion of Product A users among GPs’ total population is similar to the actual proportion of Product A users among cardiologists’ total population.
-------------------------------
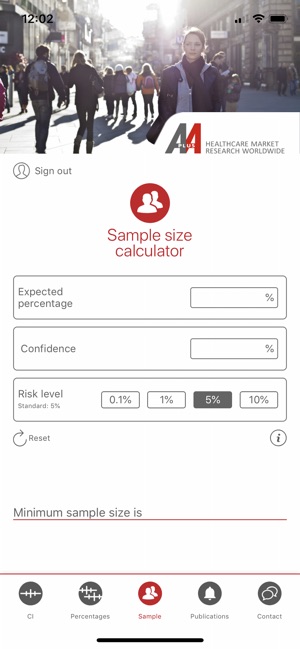
3 - SAMPLE SIZE CALCULATOR
Minimum sample size calculations:
By taking into account an expected percentage, as well as the corresponding confidence interval, it is possible to calculate the sample size needed for a given market research survey.
This application calculates the minimum sample of respondents needed in order to achieve the required level of research accuracy.
FOR INSTANCE

Research is needed to evaluate the level of use of Product A among anaesthetists. The desired confidence interval is +/-8. Approximately one third of anaesthetists is expected to be using Product A.
How many anaesthetists need to be interviewed in order to achieve this margin of error?
At 5% risk level*, for an expected percentage of 33%, with a confidence interval of +/-8, minimum sample size is 133 anesthetists.
In other words, if you interview a minimum of 133 anesthetists, there is a 95% chance to get a confidence interval of +/-8 if the proportion of Product A users in the anesthetist sample is 33%.

支援平台:iPhone